
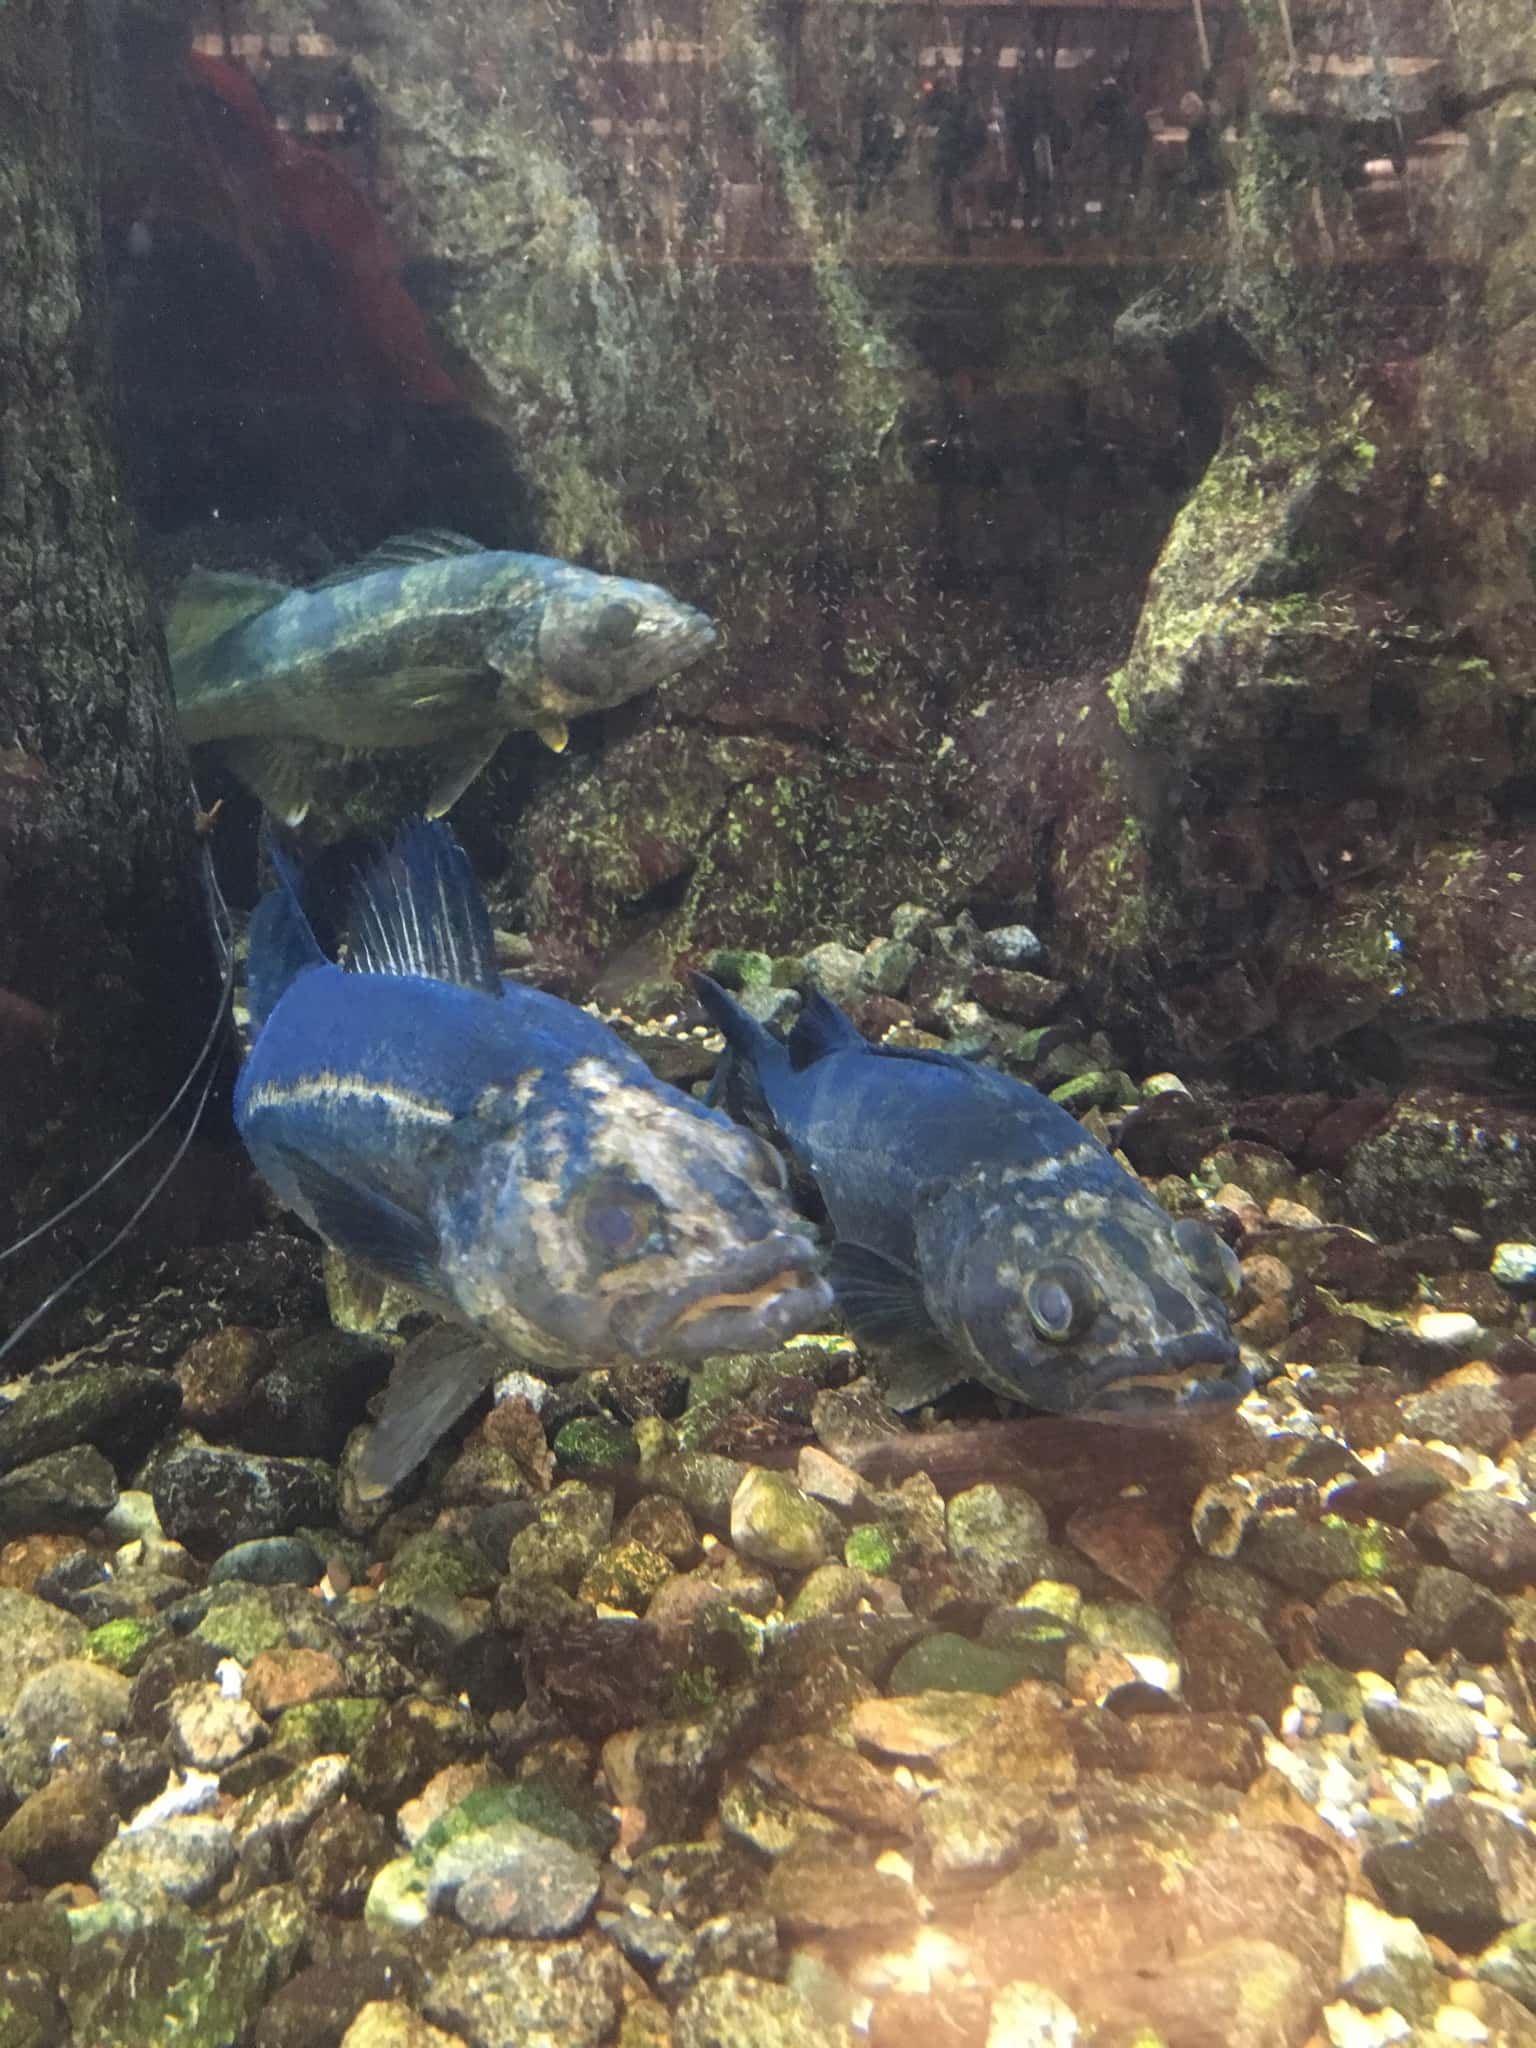
What Lies Beneath. Knowing what is in a water, and using that data to assemble a plan to fish it more effectively, can come from examining fishery survey results. Take some time and put the pieces of the puzzle together with information assembled by agencies doing the sampling. Simonson Photo.
By Nick Simonson
As agencies sample the waters throughout the upper Midwest this summer, the reports they generate show that not only is the government in action for the betterment of the angling public, but it is also helping to provide vital clues which assist anglers in their efforts after the fish that can be found in the various lakes and reservoirs across the map.
Getting beyond the numbers of walleyes, bass, or bluegills is what advanced anglers do to find the colors and presentations that work, and help transfer information from other experiences to catch more fish, bigger fish, and the fish they want to keep. What follows are those advanced items that can be gleaned with a little bit of digging into the numbers of any given survey report and how the statistics can translate to success on the water.
Predator and Prey
Looking at a list of fish can easily show what’s in the water and what anglers might expect to catch, but going a bit deeper helps anglers connect those game fish on the report with other species in the water which they might eat throughout the summer. An abundance of small white bass, yellow perch, or even rough fish like bullheads and suckers can provide valuable clues as to what walleyes, pike and largemouth are lunching on. Establishing a predator-and-prey relationship from the survey results is a good thing to know, especially when it comes to catching those bigger species.
Get Confident
With that food structure in mind, it’s easy to turn to the tacklebox and pick out those baits that have a better chance of connecting with gamefish by imitating their prey right off the launch. With realistic paint schemes on modern crankbaits designed to match a bluegill or perch scale-for-scale, and even just selecting the basic silver, gold, or colored spinner blade based on what’s getting eaten, anglers can pick out a few hues to troll and try on a new water which they’ve researched. It’s likely that a perch or firetiger pattern will pay off on those waters with yellow perch present, and purples, blues and oranges will help imitate sunnies that are maturing in the flow, providing confidence colors from the outset. Even the average size of an offering can be considered, and a bigger model of bait or oversized blade can be utilized if both the predators and their meals are a bit larger on the survey results.
Time It Right
Most agencies will also provide a historical stocking list going back several years to help give anglers more insight on what is in the water, and possibly an estimate of how many fish from a certain species are there. With an understanding of how fast fish grow in a certain area, or similar lake types across a region, it’s easy to extrapolate stocking data a few years out, and know those walleyes that were placed as fry in 2016 are likely getting into the quality eater-sized category by now. Looking over stocking reports and comparing them with what was sampled in a survey can also confirm those suspicions as to what size structure is present.
Target Acquisition
With information on species type, size and abundance it’s easier to tailor efforts to desired results. If looking for a shot at a trophy fish, an angler need only look to the far end of the size spectrum on a series of lakes to find where bigger fish are swimming. For those looking to fill the livewell and fulfill the family wishes for a Friday night fish fry, a bigger population of eater-sized fish – be they crappies, perch, walleye or others – is something to look for in the numbers. When just looking for action, it’s easy to select those lakes with good bass, pike or panfish populations to provide a steady tug on the line or a repeatedly disappearing slip float to keep things interesting. Mix the numbers with a state record list to confirm the best option to break the current bests, with the addition of some searching and some hard work, of course.
The Grand Experiment
As a facet of the combined art and science that is modern angling, learning how to read, and more importantly, utilize the information contained in fisheries surveys will help test theories, tweak presentations and develop new ideas into successful patterns on the water. While the correlation may not be one-to-one as an angler jumps from lake-to-lake, some of that knowledge transfers and the process of researching a water, knowing what is swimming and who’s eating whom below the surface, can help perfect a presentation and make it modifiable for fish of all sizes and species. Take a few extra minutes to arrange the pieces of the puzzle provided by survey reports this summer and those from seasons past to get a better picture on angling success.
North Dakota’s fishery survey data can be found at: https://gf.nd.gov/fishing/where-to-fish; South Dakota’s fishery survey data can be found at: apps.sd.gov/GF56FisheriesReports/